
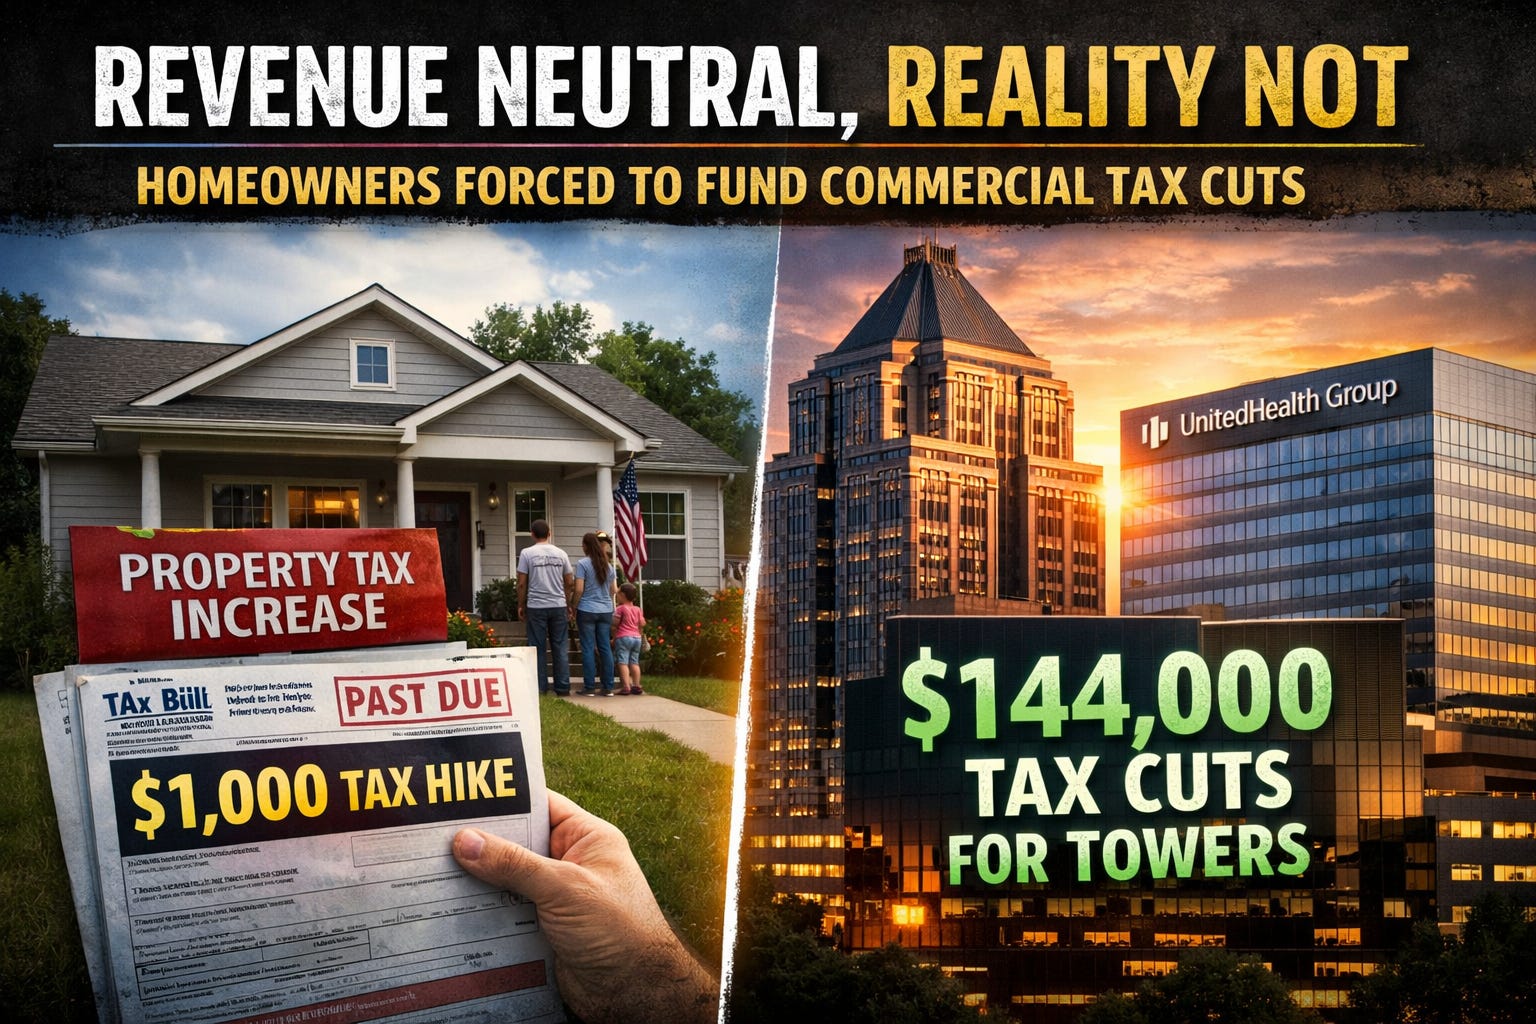
Revenue Neutral, Reality Not; Homeowners Forced to Fund Commercial Tax Cuts; $144,000 Tax Cuts for Tower; Increases for Guilford County Families
Commercial Property Revaluations Released; Who Really Pays Under “Revenue Neutral”?

TL;DR; If your home value jumped 60-80% during the housing surge, you’re about to subsidize tax cuts for large commercial properties whose values barely moved or even declined.
There’s a phrase local governments lean on during revaluation years; “revenue neutral.” It sounds harmless, technical and fair. Same total tax collected, just a different rate.
The reality is revenue neutral doesn’t mean impact neutral. It means redistribution. In Greensboro and Guilford County, that redistribution is shaping up to regressively hit lower and middle-income homeowners and tenants the hardest while delivering quiet, often substantial tax cuts to large commercial properties and luxury mansions.
Exhibit A; United Health Care Building; $80,000 Tax Cut Incoming
United Health Care / Lake Jeanette LO1 (3803 N Elm St)
2025 Value; $24.6M
2026 Value; $27.5M
Increase; +11.7%
Countywide average; ~42.5%
The gap is the thing.
Under a revenue-neutral rate (estimated around ~$0.98 per $100);
2025 Tax Bill; $351,052
Projected 2026 Bill; ~$271,000
Change; -$80,000 (-22%)
It’s not a loophole. It’s how the system was designed. If your property increased less than average, your tax burden goes down. If it increased more than average, you make up the difference. When interest rates rose, the housing market didn’t just “slow down”; demand shifted downward. That shift is why lower and mid-priced homes saw explosive value increases while higher-end and commercial properties lagged.
Exhibit B; A Homeowner Paying the Difference, as this home appreciated far above average, the owner doesn’t benefit from the lower rate, they get hit with a higher bill to offset properties like United Health.
Example; A Greensboro Home
2025 Value; $253,900
2026 Value; $460,400
Increase; +81.3% (nearly double the average)
Revenue-neutral impact;
2025 Tax Bill; $3,562
Projected 2026 Bill; ~$4,500–$4,700
Increase; +$900 to $1,100
Percent Increase; ~25–30%
Same system. Opposite outcome;
At ~3% interest, a buyer might afford a $450,000 home
At ~7% interest, that same buyer may only afford ~$300,000–$325,000
Nothing about their income changed. Interest rates did the damage and Guilford County’s Tax Department has declined to release detailed breakdowns allowing meaningful analysis of how the tax burden is shifting. Specifically, the county has not provided median or distributional data showing how property value increases vary by price tier, neighborhood or property class.
Exhibit C; Downtown Tower; Six-Figure Tax Cuts

Wells Fargo Building (300 N Greene St)
2025 Value; $34.0M
2026 Value; $37.1M (which it probably couldn’t sell for as office building values are crashing across the country)
Increase; +9.09%
Far below the ~42.5% benchmark.
Revenue-neutral impact;
2025 Tax Bill; $507,620
Projected 2026 Bill; ~$363,476
Change; -$144,144 (-28.4%)
A six-figure tax cut.
And where does that $144,000 go?
It doesn’t disappear. It gets shifted. A simple countywide average; ~42.5% isn’t transparency. It’s a smokescreen. Averages flatten reality, hiding whether;
Lower value homes saw 70-100% increases
Mid tier neighborhoods absorbed the largest jumps
Commercial and high-end private properties lagged behind
Without median increases, quartile breakdowns or class-specific data, the public is left guessing about who is really being hit and how hard.
Lack of clarity benefits the system. When the full picture is hidden, the impact becomes harder to trace and easier to defend, because once we see the distribution, the pattern becomes obvious; the burden is not shared evenly. It shifts downward.
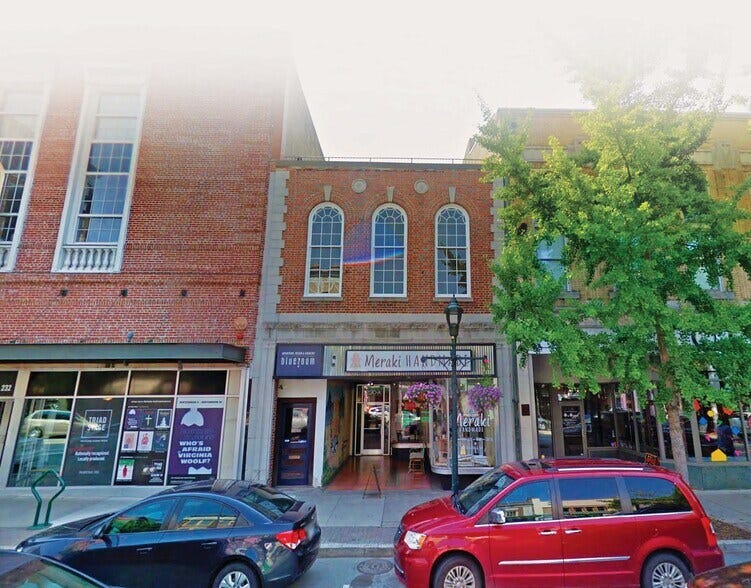
Exhibit D; Declining Commercial Properties Win
230 S Elm St (Downtown Greensboro Inc. Chairman Stu Nichols Commercial Property)
2025 Value; $1,219,300
2026 Value; $1,177,900
Change; -3.4%
Revenue-neutral impact;
2025 Tax Bill; $18,204
Projected 2026 Bill: ~$11,543
Change; -$6,661 (-36.6%)
Properties which lost value receive tax cuts, while homeowners who gained “paper value” in a volatile housing market are asked to cover the gap, and our elected leaders don’t want to say so. Once the redistribution is clearly visible, it’s no longer a technical outcome of a formula.
It’s a policy choice. That’s why the absence of detail matters. Policymakers are being protected from scrutiny. It protects the narrative of “fairness,” because averages sound balanced even when what actually happens isn’t. It blunts public reaction and protects the outcome, as a diffuse, unclear shift is far less likely to trigger public backlash than a clearly documented one.
Clarity would change that overnight.
The Mechanism; How the Burden Shifts
This isn’t accidental, it’s mathematical. The county resets values. They lower the tax rate to keep total revenue the same, except this time the greatest burden appears to be at the bottom instead of the top, and the powers that be don’t want to tell the truth.
Properties below the average increase (~42.5%) pay less. Properties above it pay more.
In this cycle;
Commercial properties (income-based, slower growth); Win
High value properties with modest appreciation; Win
Working and middle-class homes (market-driven spikes); Lose
The Reality They Won’t Say Out Loud
A family in a modest home that jumped from $250,000 to $460,000 didn’t suddenly become wealthier in any meaningful sense. They didn’t realize that gain. They didn’t sell. But under revenue neutral, they are treated as if they did and taxed accordingly.
Meanwhile, a downtown office tower that “probably couldn’t sell for $25 million”, benefits from a valuation system with a tax cut.
This is not a story about rising taxes. It’s a story about who pays them.
Under a revenue-neutral model this time;
A homeowner pays +$1,000, or ~25–30% more
United Health saves -$80,000, or -22% less
A downtown tower saves -$144,000, or -28.4% less (probably more should they appeal)
Unless policymakers acknowledge that shift and act on it, working families are going to underwrite tax breaks they never voted for and will never benefit from.
One of the most telling parts of this entire revaluation cycle isn’t just the outcome, it’s what the public can’t see.
Guilford County has declined to release detailed breakdowns that would allow meaningful analysis of how the tax burden is shifting. Specifically, the county has not provided median or distributional data showing how property value increases vary by price tier, neighborhood, or property class.
That matters.
A simple countywide average ~42.5% isn’t transparency. It’s a smokescreen.
Averages flatten reality. They hide whether;
Lower-value homes saw 70-100% increases
Mid-tier neighborhoods absorbed the largest jumps
Commercial and high-end properties lagged far behind
Without median increases, quartile breakdowns or class-specific data, the public is left guessing about who is really being hit and how hard. And that lack of clarity benefits the system.
Guilford County uses the data to validate revaluations and model tax impacts. Choosing not to release it isn’t about capability, it’s about control of the narrative.
If Guilford County and any City within wants to claim this process is fair, the solution is simple;
Release the full dataset.
Show the median increases by value tier.
Break out residential vs. commercial.
Let the numbers speak.
Until then, taxpayers are being asked to accept “revenue neutral” on faith while the evidence suggests something very different is happening underneath.
And If They Raise Taxes Instead?
Everything outlined so far assumes a revenue-neutral rate, that the county and cities lower the tax rate to collect the same total revenue as last year.
But they don’t have to.
If Guilford County or Greensboro decide to raise the rate above revenue neutral, the dynamic doesn’t change, it intensifies.
The same redistribution still happens;
Properties below the average increase still benefit
Properties above the average still carry more of the load
But now, the total bill gets bigger for everyone, and the burden on homeowners compounds.
In a system where lower and middle income properties already saw the largest valuation spikes, they are going to pay more… on a larger share… of a bigger bill.
It’s Time for a Pause
Before a single rate is adopted, revenue neutral or higher, there’s a more fundamental question that hasn’t been answered;
Do we actually understand who this revaluation is impacting and how?
Right now, the answer is no.
The data needed to evaluate the distribution of increases hasn’t been fully released.
A Pause Isn’t Radical, It’s Responsible
A temporary pause on implementing new rates would allow time to;
Analyze impacts by income level, value tier and property class
Identify distortions caused by the interest rate shock and demand shift
Correct obvious imbalances before they’re locked in
Because once the rate is set, the consequences are real and immediate. Bills go out. Appeals close. And homeowners are left dealing with increases that may have been avoidable.
What’s missing isn’t tools. It’s willingness.
This revaluation cycle is not happening in a normal market. It’s the product of;
Historic interest rate swings
Artificial demand shifts
Uneven appreciation across property classes
Freezing that moment in time and building a tax system on top of it without full transparency is a mistake.